
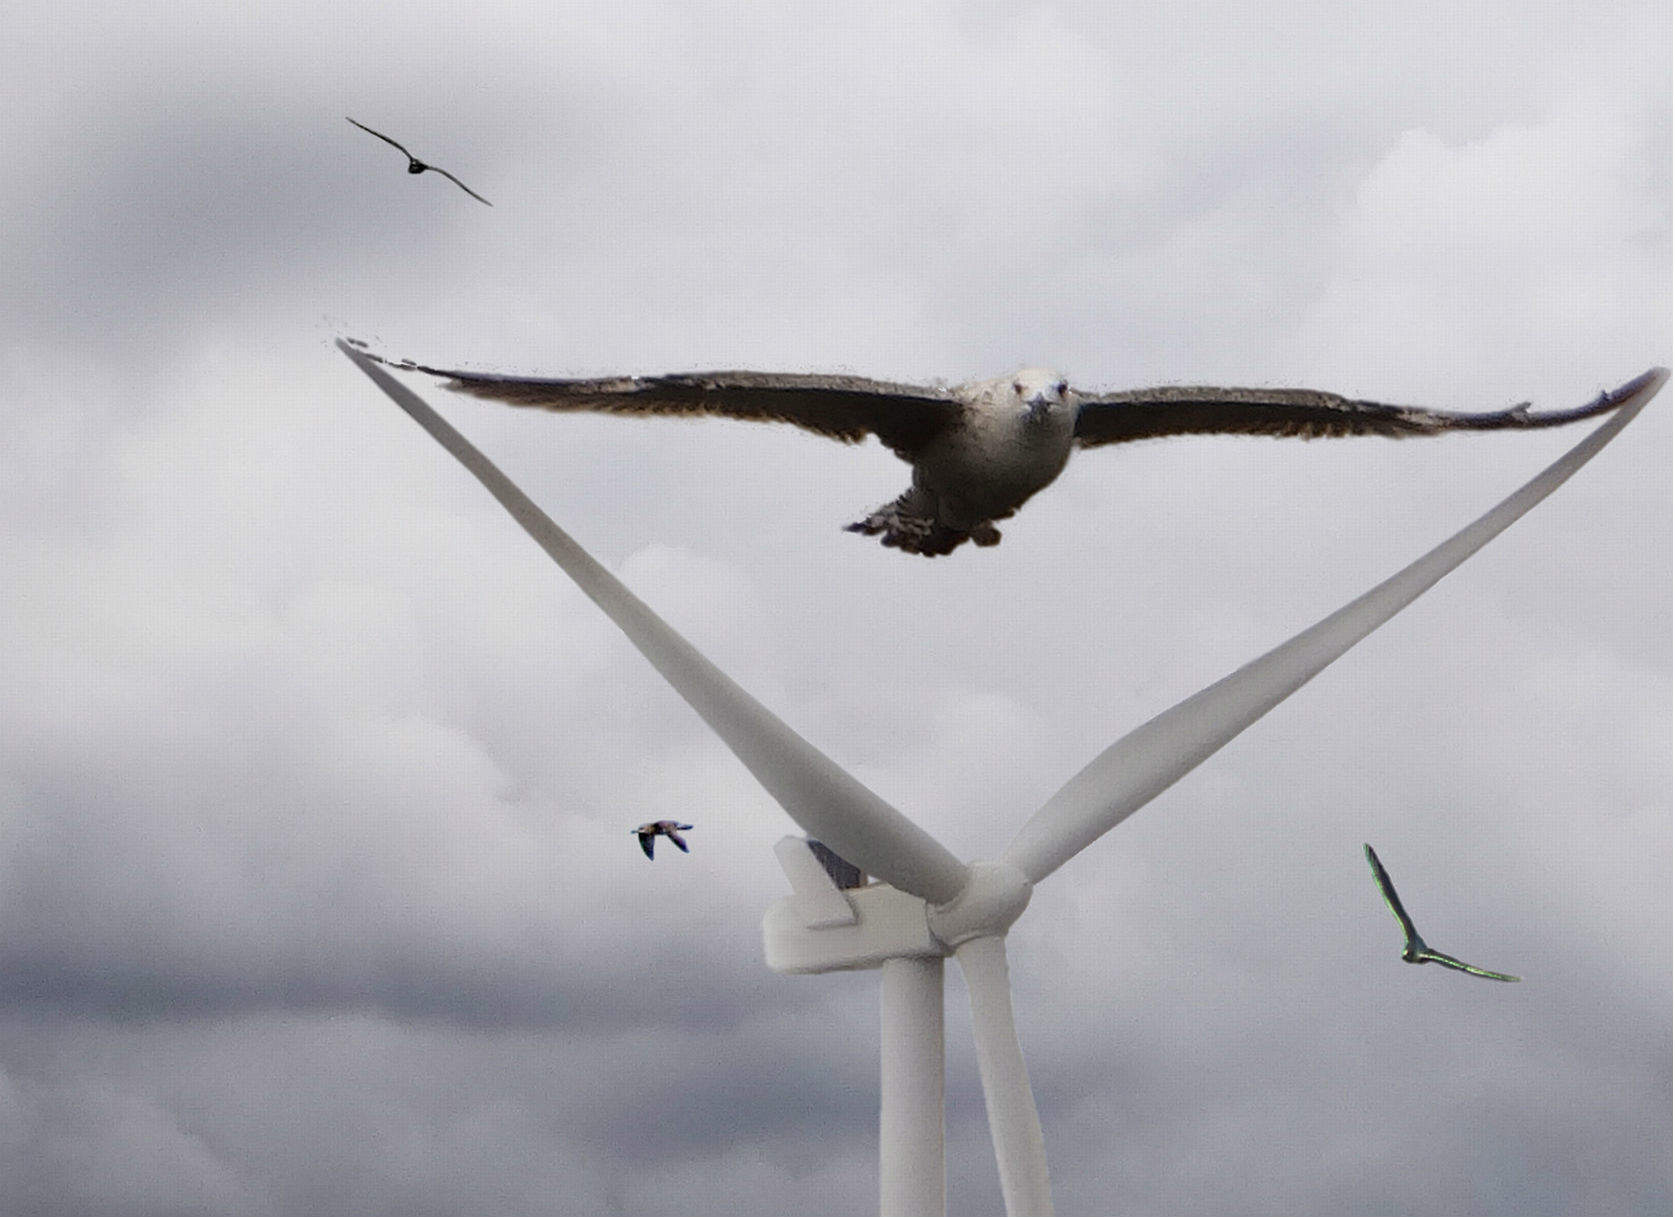

Renewable energy generation can come up against a number of barriers, including subsidy cuts and resistance from groups that believe that the development of solar or wind farms could be disruptive to surrounding wildlife.
Go deeper with GlobalData

Discover B2B Marketing That Performs
Combine business intelligence and editorial excellence to reach engaged professionals across 36 leading media platforms.
Esri UK is an international supplier of Geographic Information System software (GIS), which helps visualise data of an area by turning pictures from drones into a detailed birds-eye view map. At the Esri UK Conference this May, a talk by Atmos Consulting outlined how Esri’s ArcGIS mapping technology could be used to understand bird behaviour and the importance of this when building wind farms.
Turbines in competition with nature
Onshore wind farms are often planned in large open spaces, away from houses, and thus can get in the way of birds’ flight paths. By using maps and surveys, Atmos showed how it’s possible to chart the movement of birds and determine whether turbines would disrupt species behaviours, or even be dangerous for them.
"Turbines have got a fairly large impact for several different reasons," says Atmos principle consultant Tom Hartley. "Whether it’s the landscape and visual impact, or noise impact, or habitats, or birds."
Hartley explained that a key challenge for renewable energy developers is that they are currently in an environment to "do more with less" because of subsidy cuts and less government support.
"A lot of projects are less economically viable than they were a year or two ago," he says. "So we’re looking a lot at how GIS can make the planning process more efficient."
He said that past experience is now shaping the wider industry statutory guidelines, and an innovative modelling approach, combined with expertise in bird behaviour, is helping to remove objections and progress development projects more quickly.
"GIS has always heavily worked in the onshore wind industry because it’s a really good match," he says. "The data has a long shelf life; I’ve been working on projects for a decade or so…sometimes you have to access data that was recorded ten years ago and know exactly why it was captured, and how. The data has to be quite robust."
Case study: Leadhills wind farm
The case study took place at Leadhills wind farm in South Central Scotland. Wind farms are a maturing sector and so there has been a lot of environmental information made available for assessments from the National Trust for Scotland and Scottish National Heritage.
The wind farm was within 2km of a special protection area, which is a European level designation for birds where many species such as hen harriers and peregrine falcons reside.
Hartley explains that the standard approach to bird activity and surveys for a wind farm was to do vantage point surveys.
"You have an observer out on site for a fixed number of hours, a fixed number of times per month, over a two year period," he says. "So you build up an activity level of what’s being observed and extrapolate that into an annual value."
However, the Scottish National Heritage had concerns that the survey data didn’t capture the full picture and objected the scheme. This was likely to be because the team didn’t record much activity from the birds of prey species they were monitoring.
"The main impact you’re looking at when you’re assessing birds and wind farms is collision risk, and there’s two types of collision risk," explains Harley. "The first one is when you’re looking at a predictable or linear set of activities, so that might be geese flying directly over the site, in a repeatable way.
"But if you’re looking at birds of prey, you’re much more likely to do a random model where birds are hunting over the site, and you can’t define the consistent flight patterns they’re going to be using."
In order to do a random collision model, turbine air space has to be mapped in 3D to determine how much of that space is taken up by the rotas. With this the activity levels of the birds within that airspace are then calculated to find out how many times the birds are likely to come into contact with the turbines over a fixed period of time. This has to take into account how fast birds tend to be flying and how fast the turbines might be moving.
Hartley says that to come up with an analysis that didn’t have the flaws of the field survey data, the GIS and ornithology teams got together and developed a model based on nest locations and ranging behaviour.
They gathered information from literature about key species and how they operate around their nests, how long they spend at different ranges from nests, how that differs between males and females, and produced a large data set.
Combining old and new: future maps and surveys
"One of the things that we were missing from that was the typical flight lines for those birds, which doesn’t tend to be found in the literature, " Hartley says. "And then we realised that we had the answer to that ourselves."
Atmos has been doing vantage point surveys for wind farms for a decade, and do had over 25,000 flight lines in a single central data set available from different parts of the country, different habitat types, and different species.
"We were able to extract the statistical information about the heights those birds tend to be flying," says Hartley. "And therefore that was going to be one of the missing pieces of the puzzle."
With the new plans, the wind farm was given the go-ahead because the results revealed there was a low risk of impact between birds and turbines.
Hartley says that in general, the model has a lot of different applications. It could be used for different species, different habitats, and different locations around Scotland and across the UK. Overall, mapping looks set to be a very useful tool in future developments of renewables by assisting older methods.
"We’re looking quite carefully at whether these types of models can be used to augment or replace some of the traditional survey methods over a longer period of time," he says. "This is a case where GIS has fed into an existing, well established system and broken down some of the existing, standard practices and made some projects a lot faster and more efficient."
