
Visplore Integration: Streamlining Your Data Workflow
In today’s data-driven world, seamless integration between various tools and platforms is crucial for efficient analysis and insights. Visplore understands this need and offers a robust set of integration features designed to streamline your data workflow and empower you to make informed decisions faster.
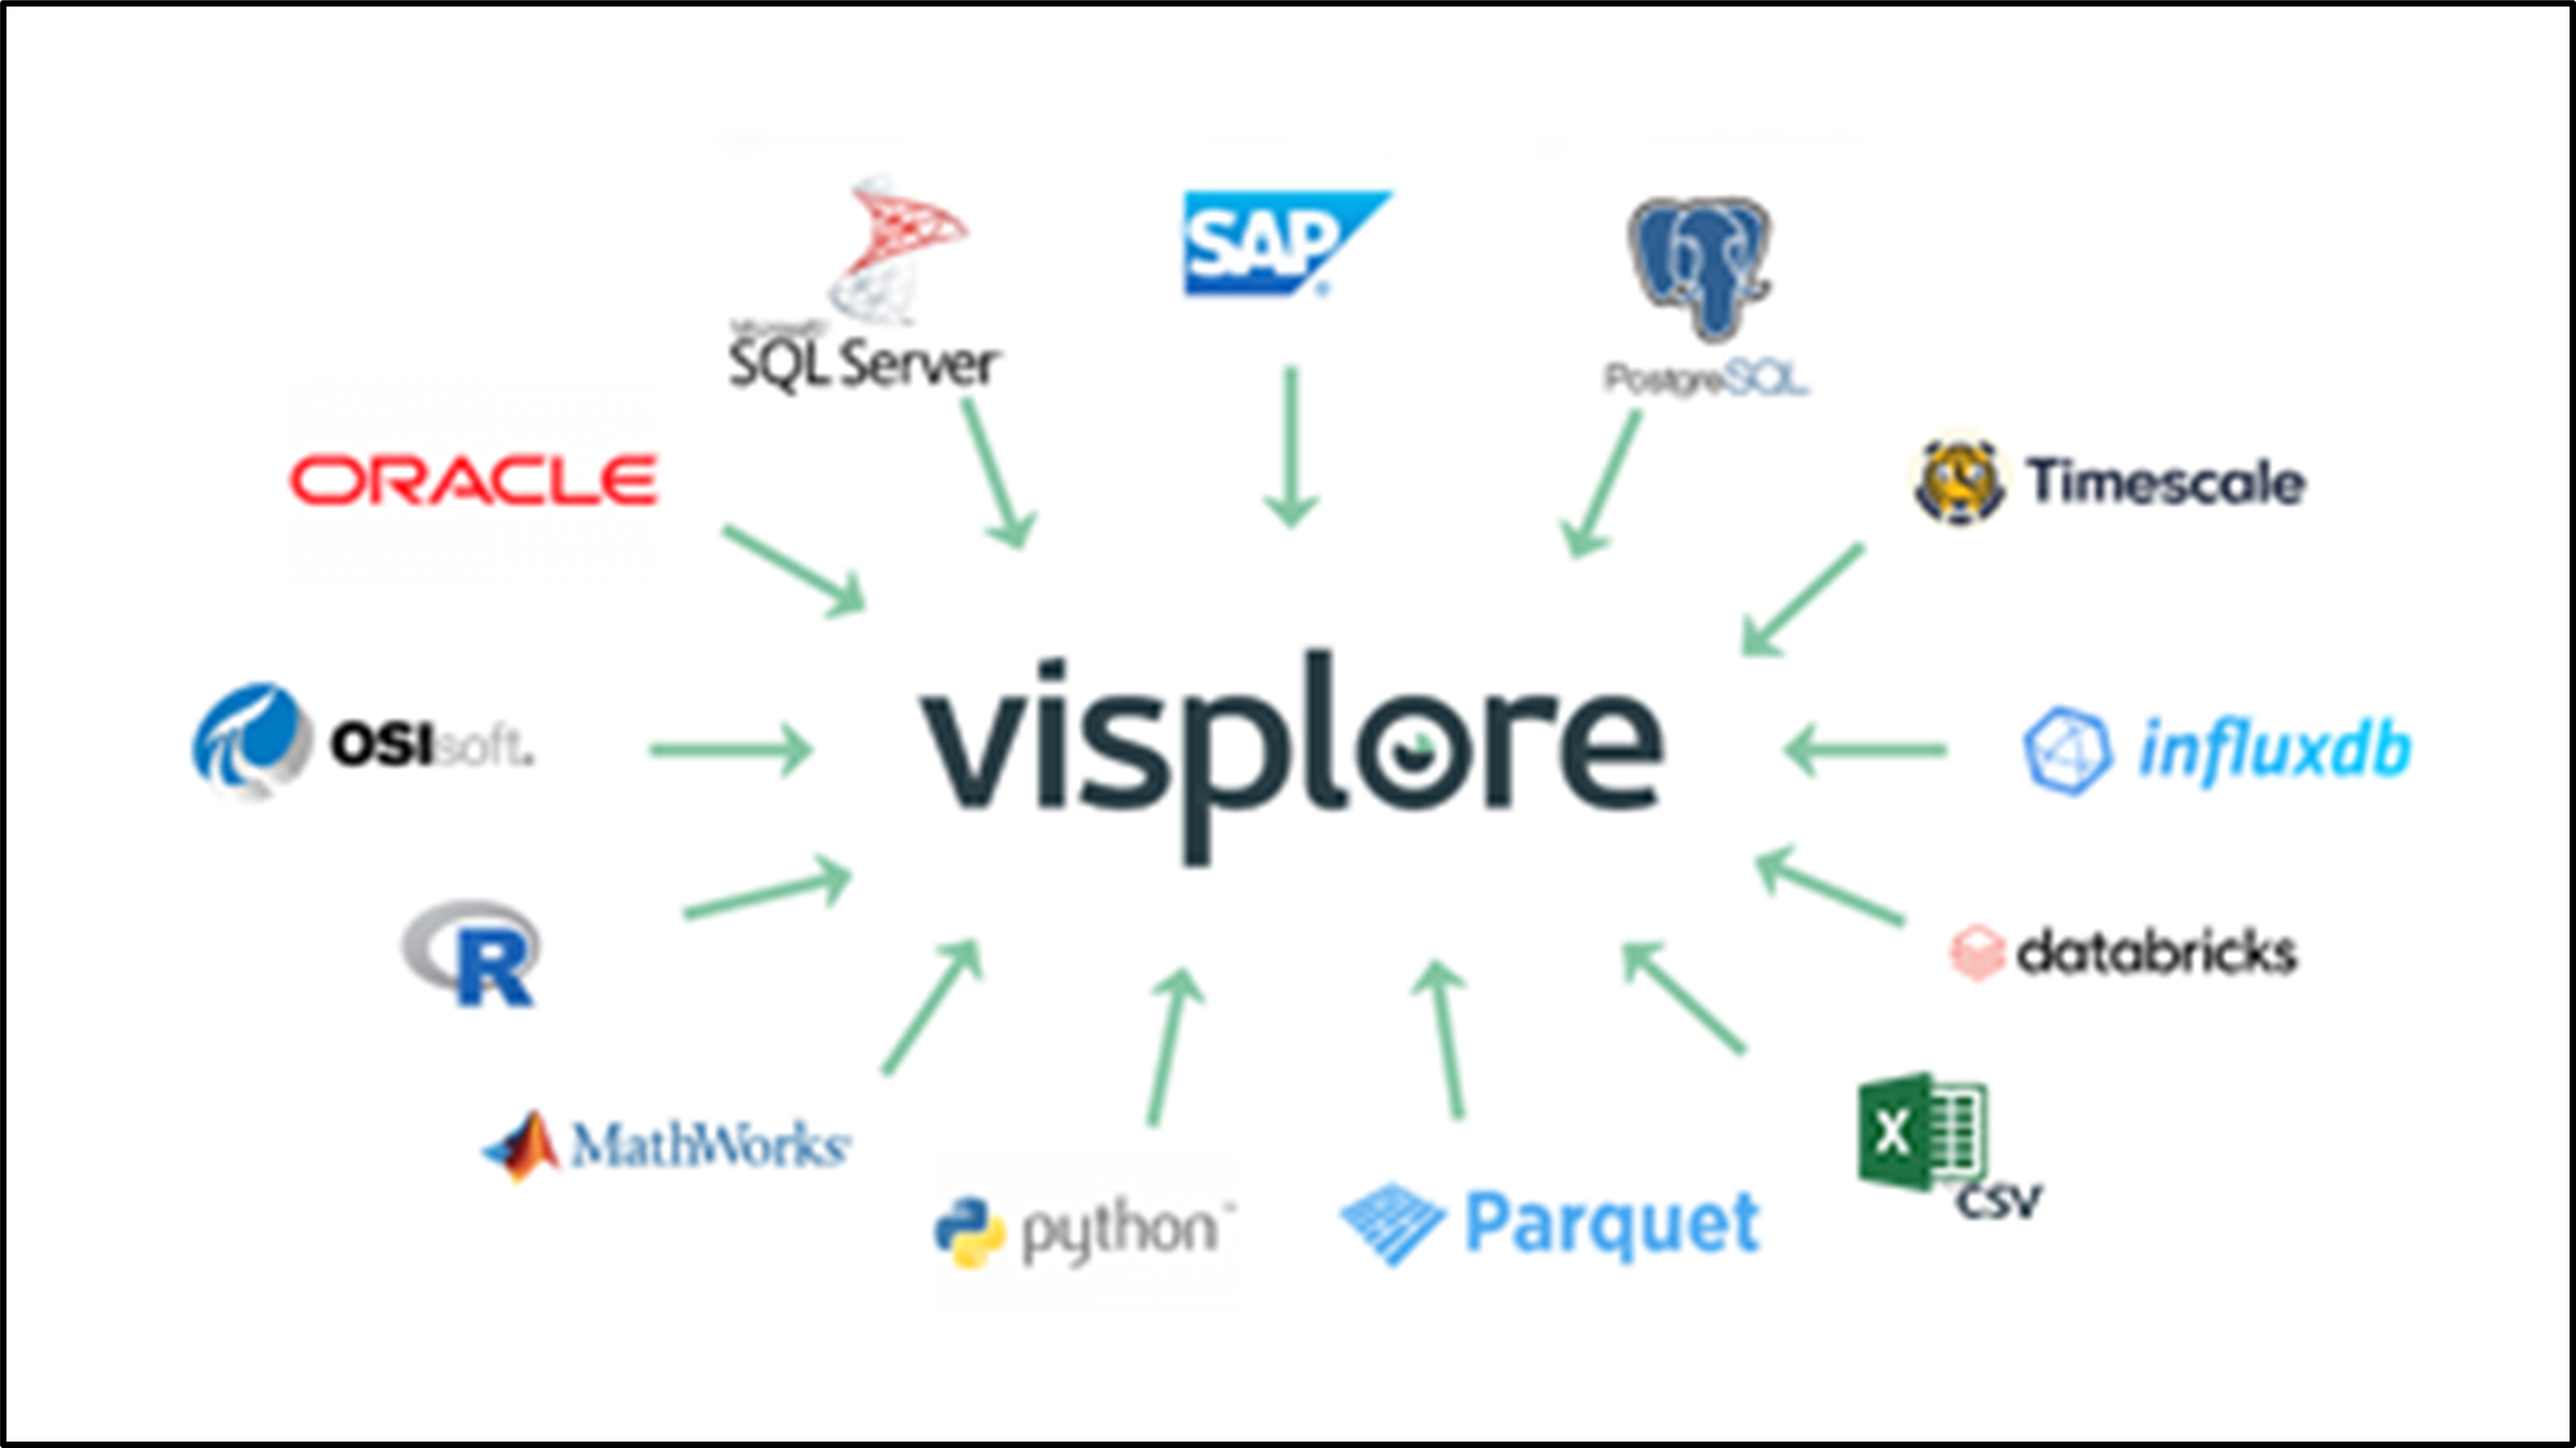
Data Connectivity Made Easy:
- PI System Integration: Access and analyze real-time and historical data from your PI System directly within Visplore. Define scalable analytics across your assets and update the analyzed data live, enabling immediate identification of trends and anomalies.
- Database Connectivity: Browse database tables or views and define ad-hoc filters to access specific data subsets easily. Set up custom filter masks for regularly used datasets, saving you time and effort.
- Flexible Data Import & Merge: Import and merge data from various sources, including CSV, Excel, relational, and time series databases or data lakes in Visplore with ease. The platform automatically recognizes data types and suggests optimal structures for analysis.
Data Preparation Simplified:
- Automatic Data Alignment: Visplore automatically aligns time-stamped data from different sources, even if they have varying time scales or units. This eliminates manual manipulation and ensures accurate analysis across diverse datasets.
- Correlation Discovery: Identify connections between process parameters and quality indicators within minutes, considering different products, suppliers, and other factors. This accelerates root cause analysis and helps you optimize your processes.
- Reshaping long and wide formats: Convert typical time series and IoT data formats into a structure suitable for correlation and asset comparison. This prepares your data for deeper analysis and reveals hidden patterns.
Unleashing the Power of Python:
- Python Integration: Leverage the strengths of both Visplore and Python with a seamless integration. Perform interactive visual data exploration and data preparation within Visplore while utilizing Python’s extensive analytical capabilities.
- Advanced Analytics: Use Visplore to label time-series data and create multivariate regression models that you can export to your Python scripts. Seamlessly combine Visplore and Python to build advanced condition monitoring tools.
Benefits of Visplore Integration:
- Reduced Time to Insights: Eliminate the need for manual data manipulation and integration tasks, allowing you to focus on analysis and decision-making.
- Improved Data Quality: Automatic data alignment, filtering, and optimization ensure the accuracy and consistency of your analysis. Cleanse your data interactively, and detect outliers automatically.
- Deeper Insights: Uncover hidden correlations and patterns across diverse data sources, leading to a more comprehensive understanding of your processes and operations.
- Enhanced Collaboration: Share and collaborate on data easily with colleagues through seamless integration with various platforms and tools.
- Flexibility & Scalability: Visplore’s integration features adapt to your specific needs and scale with your growing data volume and complexity.
Conclusion:
Visplore’s integration features offer a powerful solution for streamlining your data workflow, saving you time, and empowering you to extract valuable insights from your data. Whether you’re working with real-time PI System data, diverse databases, or complex time series, Visplore helps you connect, prepare, and analyze your data efficiently, leading to better-informed decisions and improved outcomes.
