
 The OpenGridMap project is a simulation model created by researchers at the Technical University of Munich (TUM) using a mixture of satellite images and crowd sourcing to map out electricity grids. The information collected is then freely available for anyone interested.
The project aims to provide an approach for understanding faults and possibilities inspired by the Open Street Map project. “Open Street Map is basically a Wikipedia of maps; they have had a lot of success creating an open data source of maps which can be used by anyone,” says OpenGridMap director Jose Rivera. “We had a lot of inspiration from the Open Street Map project, that's why the name is basically a derivative version of that.”
Go deeper with GlobalData

Discover B2B Marketing That Performs
Combine business intelligence and editorial excellence to reach engaged professionals across 36 leading media platforms.
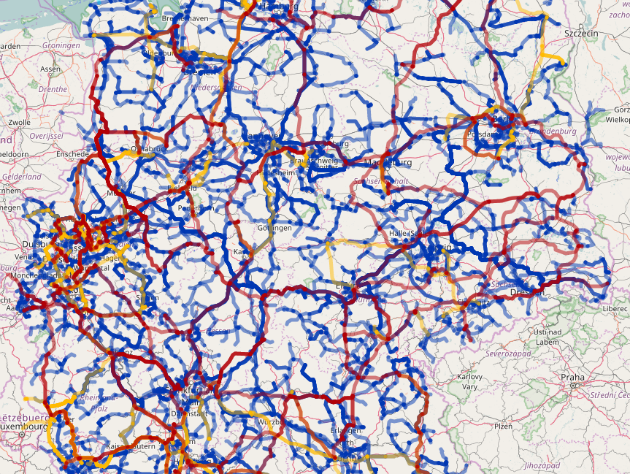
Applying this concept, Rivera and his team have been able to create a fully automated map of energy grids worldwide. Completion of each map is dependent on the level of community involvement in each country, as much of the mapping relies on crowd sourcing of information. Germany has the most complete map, which depicts 99% of the country’s grid. European countries are currently the most developed, with 82% of the UK's grid mapped. Meanwhile, data for South America and parts of Africa remains limited.
Crowd sourcing with applications
The OpenGridMap project bears many similarities to the Open Street Map in its construction, although adapted for the power industry. “The power industry has a lot of peculiarities, there's a lot of knowledge that you need to have which is very specific. It's not like a street which can be mapped by anyone,” says Rivera. “Power elements require a higher level of technical knowledge, and we thought we could have a solution that is inspired by Open Street Maps but adapted to the specific knowledge that is required for mapping power grids and power devices.”
The OpenGridMap project uses a range of sources to build its maps, including drones, expert classification, existing map APIs, and graph inference algorithms. “[We took] the elements [visible in the satellite images] and verified that they were power elements, and that they are defined correctly. Then we put them together in order to build models,” says Rivera. “We've been doing that for things that can be recognised from satellite imagery, which for the most part are transmission elements, and transmission grids.”
The challenges of distribution grids
The images gained from the satellites show larger and easily visible parts of the energy network, mainly the transmission, but not the distribution elements. “If you go down to the distribution grids it becomes a lot more complicated, because you cannot recognise them from satellite imagery,” says Rivera.
Further challenges became apparent with the digitisation of the data. There is no algorithm efficient or detailed enough to completely construct the maps based on just the satellite images, which complicated the construction of simulated models. The Open Street Map project faced the same problem with the mapping, and this is where the concept of crowd sourcing came into its own. The Open Street Map team was able to map by hand the smaller and less apparent elements using a number of interested individuals.
Rivera and his team also turned to crowd sourcing to complete their grid maps, developing a mobile phone application which participants could use to map elements of the energy grid. “Mapping distribution grids requires you to go to the places, and look where the transformer is and map it by hand. That was a bit difficult and unreliable,” says Rivera. “So we developed an app which allows you to map and take a picture of these devices, and then upload them to our platform. The reason we ask for a picture is in order to verify that the device is actually there.”
It is very important that the data is managed from start to finish by a research team, explains Rivera, as “having just the geographical location of things doesn't really help you to conduct studies, to make proposals, or to study the system.”
He adds: “In order to do that you need a simulation model. Just having part of the process doesn't really help so what we created is a pipeline with support from the collection until the model generation, and it's done automatically. The more people who collect data, the models get updated automatically.”
Academia vs. reality
The project has created a vast body of information which is being put to a multitude of uses. In particular knowledge of energy infrastructure will enable research into the effectiveness of the grid systems. This is especially important in light of ongoing global efforts to decarbonise through efficiency and by using increasingly mixed energy sources.
Rivera is hoping that the availability of the information will encourage the development of new solutions to common grid problems such as bottlenecks, in order to keep grids running as efficient as possible. “When more people think about renewable energy and have the possibility to propose solutions, those solutions tend to improve and so does the availability of potential solutions,” Rivera says.
If the data gathered by the OpenGridMap project has such potential for future research, why wasn’t this kind of information available before? “I think that there is a bit of a disconnection between academia and reality, in the sense that we usually just come up with some algorithms and we test them on standard grids,” says Rivera. “Standardised data is usually enough; these standard grids are pretty good for comparing research.”
Standardised data has been freely and readily available and has been used widely in straightforward academic contexts, but detailed practical data has not been widely circulated. “Going the extra step and using our own algorithms, our methods, and our solutions on real data has not been done because the data was just not available,” explains Rivera. “The data was not available because a lot of utility companies or the people who own this data decided they didn't want to make it publicly available or would charge a lot for it.”
Completing the maps
The OpenGridMap project has great potential to influence energy sector research, especially once it is completed. “I think it's important for people to complete the maps so they have a data set they can use to conduct studies,” says Rivera. “What's important is that when you create a study, you can share the data you used in the study. That improves reproducibility of a study. It doesn't help if a company comes up with some sort of report or recommendation where other people cannot reproduce it; that's just an opinion, that's not science.”
The OpenGridMap team is set to release a complete report explaining exactly how much of the world they have been able to map and what this has achieved. This information could provide a much fuller understanding of energy infrastructure than has ever been available, facilitating research and possible improvements to grid systems globally.
But for now, Rivera is continuing to urge people to join in the project to help map the world’s energy grids.
