
The ability to map the solar potential of a region brings numerous benefits, visibly showing the wasted energy and highlighting the opportunities that solar panels bring. It is perhaps unsurprising, then, that over the past few years solar mapping tools have been developed in different areas of the world by a number of companies and researchers.
One of the biggest and best-known is Project Sunroof, launched in 2015 by Google Earth. It was initially developed as a “20% project”, a programme Google runs that allows employees to work on whatever they want for one day a week, but has since been adopted and scaled up, following its initial success in its application in Boston, San Francisco and Fresno.
Go deeper with GlobalData

Discover B2B Marketing That Performs
Combine business intelligence and editorial excellence to reach engaged professionals across 36 leading media platforms.
In a matter of seconds, the system can use machine learning to assess a roof’s solar potential. Using this information, “Project Sunroof recommends an installation size to generate close to 100% of your electricity use, based on roof size, the amount of sun hitting the roof and your electricity bill,” according to Google.
A rush of solar mapping tools
Project Sunroof is by no means the only solar potential map, with others including the Global Solar Atlas created by the World Bank and the New York City Solar Map. “There were a number of tools developed before the Google one was released in the US,” explains Anna Bruce, senior lecturer at the University of New South Wales (UNSW) School of Photovoltaic and Renewable Energy Engineering. “In 2012, Jessie Copper and the UNSW project team tested the accuracy of a range of approaches, and then adapted the approach used by US partners NREL and CUNY using ArcGIS and SAM (NREL’s Solar Advisor Model).”
Funded by the Australian Government’s Smart Cities and Suburbs programme, the Australian Photovoltaics Institute (APVI) together with UNSW have since developed a solar map that currently shows the potential of Adelaide, Brisbane, Canberra, Melbourne, Perth and Sydney. APVI has been involved in solar potential maps for years, its collaborative project born out of an American programme.
“The original SunSPoT platform was inspired by the New York City Solar Map,” says Bruce. “APVI director Olivia Coldrey spent time at the City University New York in 2012 as a US Climate Change Fellow with the Department of State and was excited to see how the map was promoting the uptake of solar and facilitating engagement with the local utility around planning and incentives for solar. She encouraged us to put in a grant application to do something similar for Australian cities.”
How do solar potential maps generate an accurate assessment of the amount of energy solar panels could create?
How do solar maps work?
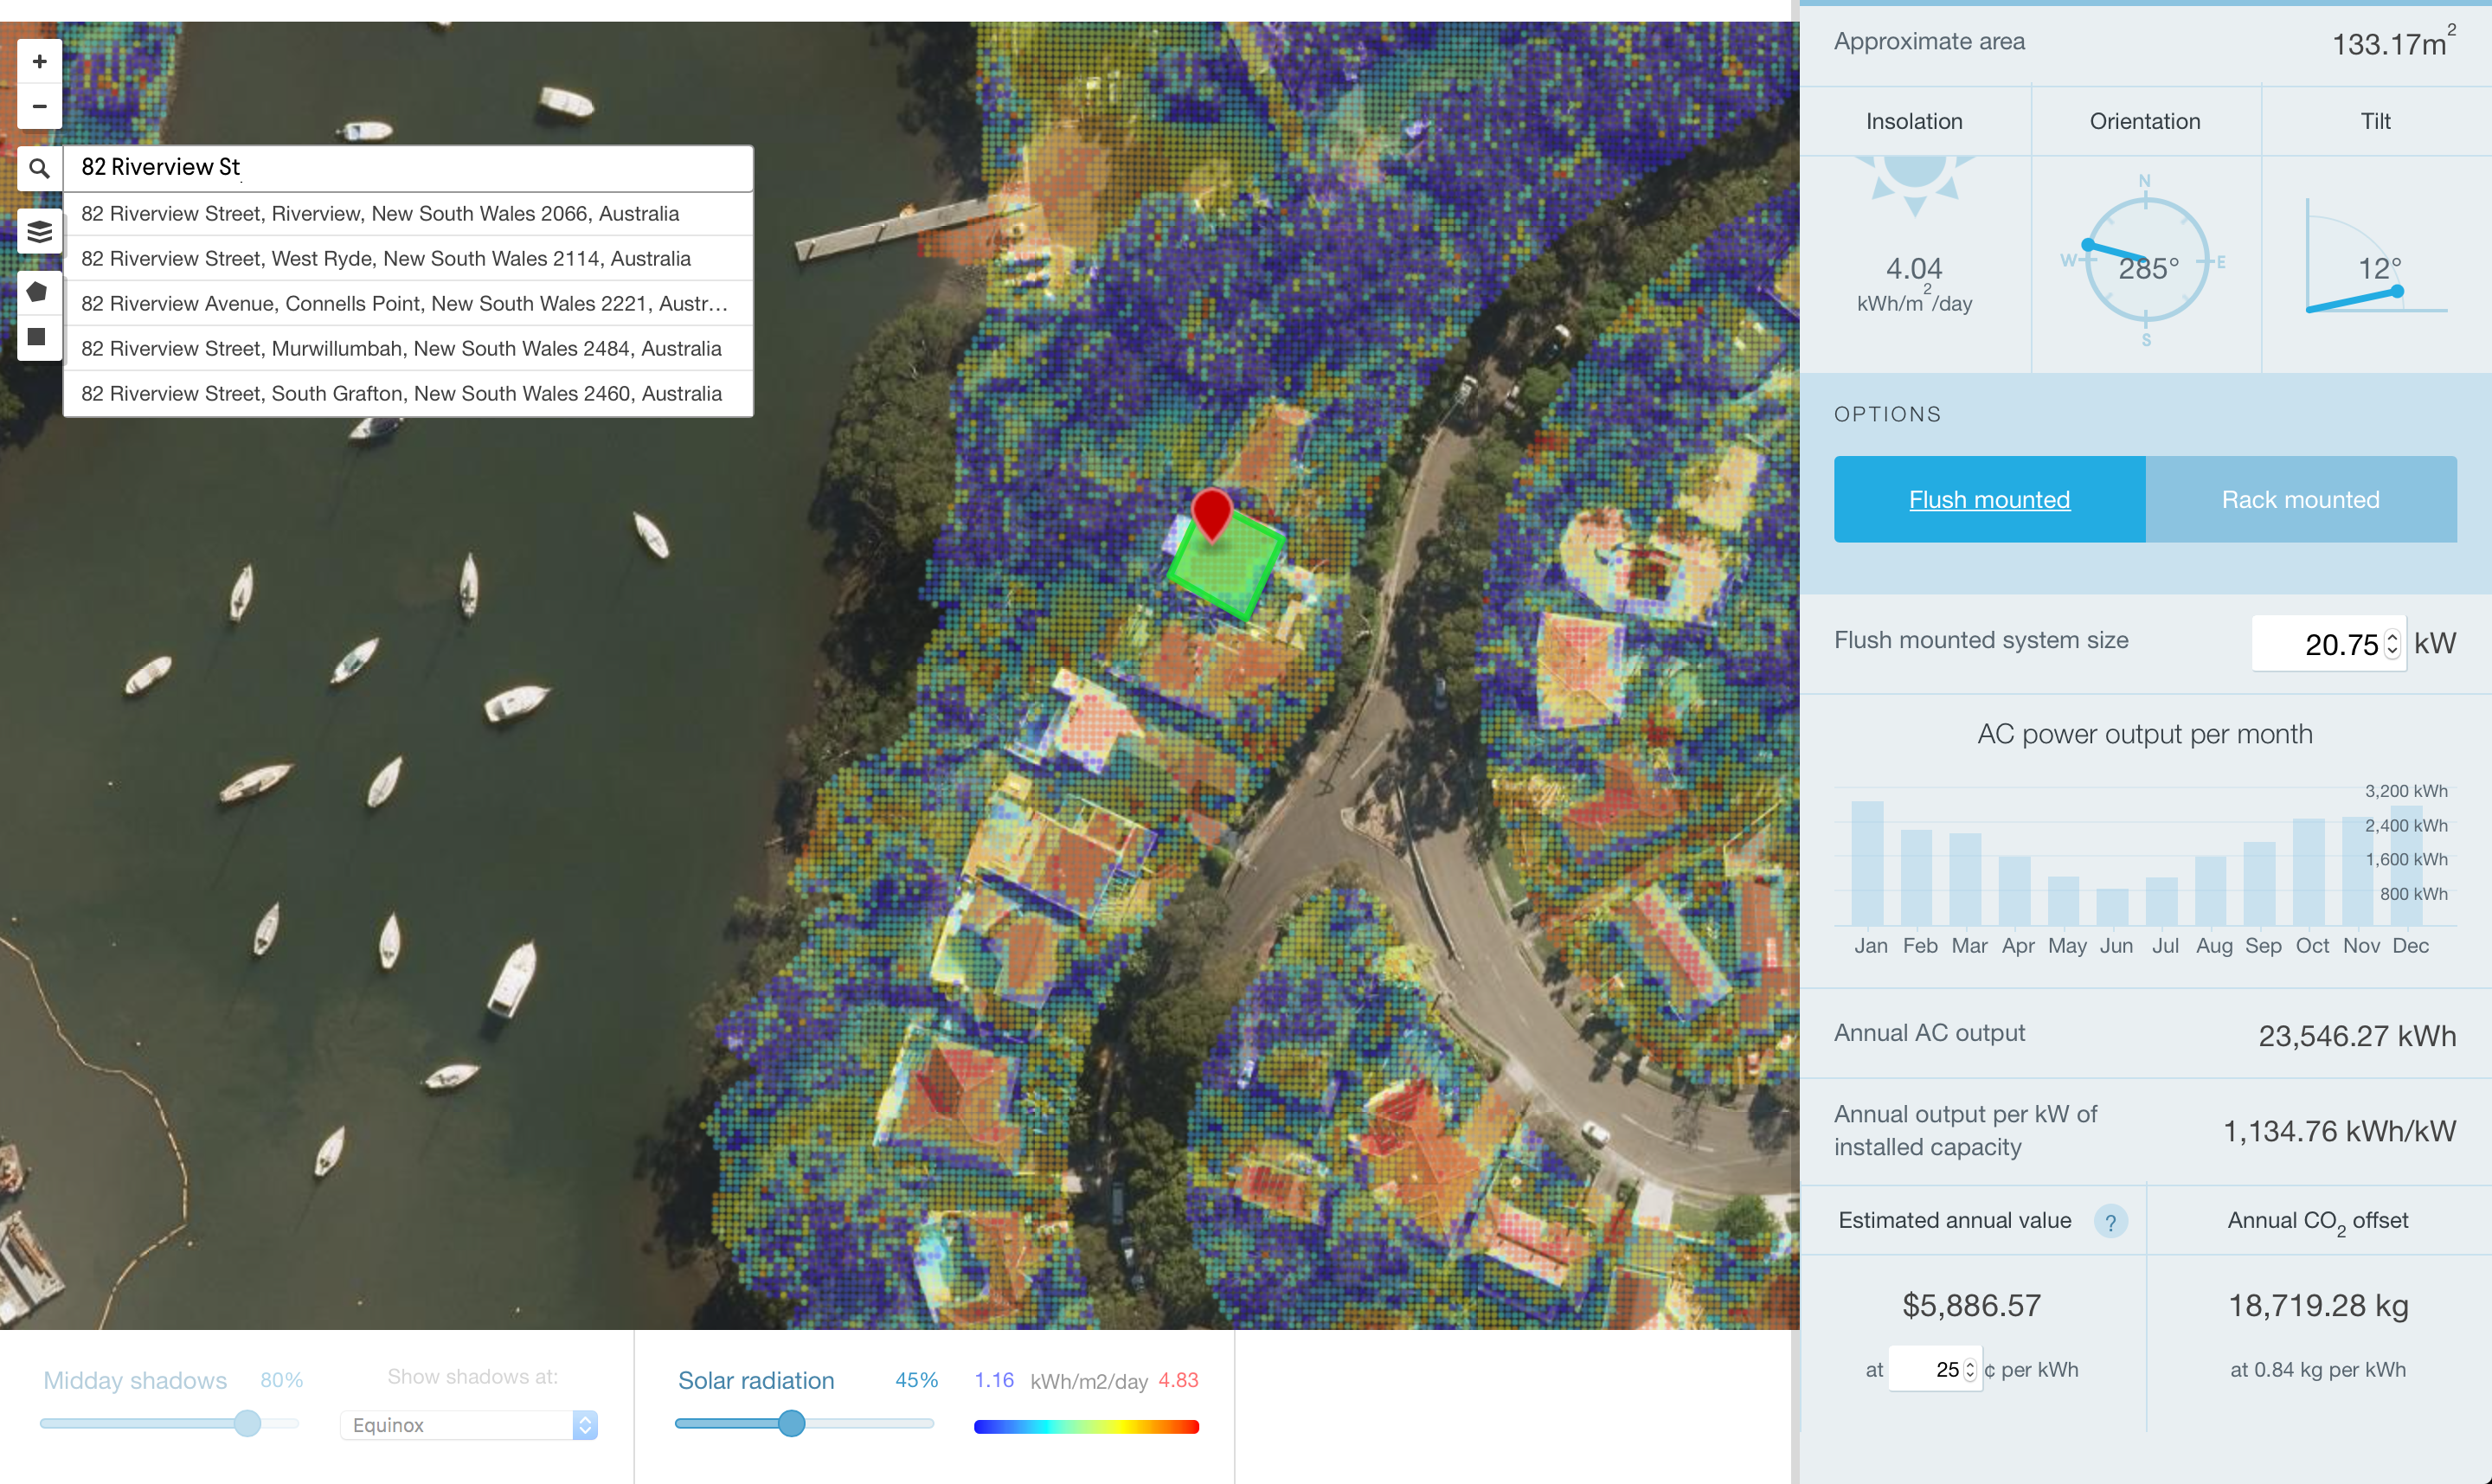
Solar potential maps work by combining information about solar radiation, orientation and available area with location maps to generate a model that can be used to estimate how many hours of sunlight a roof gets. Using this information, they can then estimate the solar potential a specific space or building has. This information can be used to inform people about which solar panels, how many and which position would create the most power and best returns.
“The SunSPoT Tool is an interactive online tool that allows users to estimate the potential for electricity generation from PV on building roofs,” explains Bruce. “The tool accounts for solar radiation and weather at the site, PV system area, tilt, orientation and shading from nearby buildings, and vegetation. An accurate assessment of the PV system energy generation, emissions saved and a simple estimate of the electricity bill savings is provided.”
While observing and studying the solar potential of different world regions is not necessarily new, developing a platform that is accurate enough for individual predictions has been challenging. Not only do solar potential platforms have to take into account the geographical location of a building, but its size, the type of roof it has and the limitations that has upon PV installation, and how exposed it is – for example, if a tree throws a shadow across the building.
Gathering enough high-quality data to ensure an accurate prediction has previously held back solar potential maps. “One of our biggest challenges has been the availability of only low-resolution LiDAR data across most of Australia,” says Bruce. “One of the main contributions of our project has been the methods developed by Jessie Copper to use statistical methods to make use of low-resolution LiDAR data to determine roof tilt and orientation.”
What could solar potential maps achieve?
All solar potential maps seek to encourage a greater adoption of solar technologies. Around the world, solar PV installation and generation is growing at a previously unimaginable rate. In 2016 it was the fastest growing source of new energy, and as the price of panels continues to plummet this trajectory is set to continue.
Encouraging reliance on solar power decreases the need for harmful fossil fuels and bolsters energy security. Renewables make up a key component of global efforts to keep temperature increases within 2°C of pre-industrial levels, a pledge 175 parties committed to as part of the Paris Climate Agreement. Countries such as Australia, in particular, have a lot to gain from a greater adoption of solar PV systems.
“Solar will be critical for Australia to meet its emissions goals, and to make electricity more affordable for consumers,” says Bruce. “Australia’s electricity sector accounts for around one-third of national emissions, and there are limited options for low-cost abatement outside of the electricity sector. Australia must therefore transition rapidly to a high renewable energy electricity system.
A focus on solar savings
Both the Google and UNSW platforms highlight the economic benefits of solar PV installation. Sunroof includes a personalised solar savings estimator that can tell each household just how much it could save on electricity per year by installing solar panels.
“Solar is expected to be the least-cost form of generation technology in future and rooftop PV is already an excellent investment for households, giving typical paybacks of four to six years,” says Bruce. “The Australian energy market operator expects that rooftop PV, which is at about 6GW now, will be around 20GW by 2030.”
As SunSPoT is developed and refined, it will place a higher emphasis on the economics of solar PV installation, working with innovative energy data companies Solar Analytics and Enosi.
“The new version of SunSPoT that we have under development will give an estimate of the bill savings from rooftop solar and battery storage,” says Bruce. “Because solar PV generates at certain times of the day and energy is worth different amounts depending on the tariff, it is difficult for consumers to determine the value of demand-side investments and for planners and decision makers to identify the best opportunities for these technologies.
“For instance, in Australia we have minimal export tariffs of around 6 c/kWh-12c/kWh compared with around 30c/kWh retail prices, or more than 50 c/kWh at peak times. Therefore, the amount of energy exported is a significant determinant of the value of the energy generated and the payback time for the investment.”
We will certainly see an uptake of solar potential maps around the world, as they develop in range and accuracy. Google’s Project Sunroof is launching in new countries, most recently the UK after partnering with E.On, and plans to continue to expand across Europe. UNSW’s SunSPoT is undergoing a number of updates to ensure users can truly understand the solar potential of a building without having to send someone up to the roof.
“The new SunSPoT Tool will provide information and analysis to help consumers, PV businesses and other energy service companies make better decisions about investment in PV and other demand-side technologies, and choose a suitable retail tariff to optimise the value of PV investments,” says Bruce. “Accurate PV generation estimate data over a year will be compared with load data over a year to calculate the value of the energy under the selected tariff. Storage will also be added to the simulation.”
