


Market forecasts usually treat a construction pipeline as a large population of projects, in which some slip, some accelerate, and the errors mostly cancel out in the total. That approach works when value is spread widely across many projects, but the data centre pipeline does not fit that description.
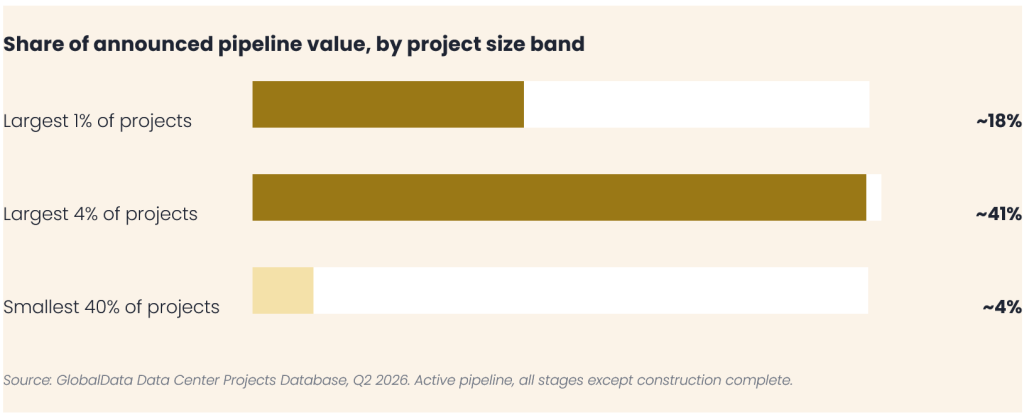
Across the roughly 2,500 projects in the active global pipeline tracked by GlobalData, the largest 4% account for around two-fifths of total announced value. The largest 1% alone account for close to a fifth. At the other end of the scale, the smallest 40% of projects together represent about 4% of the money.
The gap between the typical project and the average project tells the same story. The median project in the pipeline is worth around $350M, while the mean is more than three times higher, pulled up by a relatively small group of very large campuses.
Why concentration changes the risk
When value is spread evenly, forecast error is statistical and the total is fairly stable. When value is concentrated, forecast error depends on individual projects. If a handful of the largest campuses slip by a year, whether through a grid connection queue, a planning challenge or a change in the owner’s capital plans, national and regional totals move immediately.
That risk is not hypothetical. The largest campuses need transmission-level grid connections rather than distribution-level ones, which puts them in the longest and least predictable approval queues.
Two different approaches
The shape of the pipeline effectively splits the analytical work in two. For the few dozen campuses at the top of the market, which between them determine the outcome, statistical analysis is of little help, and each project needs to be understood on its own terms: who owns it, whether power has been secured, what stage it has reached and whether it has moved recently.
The long tail needs the opposite treatment, because no single small project matters much on its own. What the tail shows as a whole is whether demand is genuinely broadening across regions and operator types, or whether the market amounts to a handful of large sponsors plus noise.
The question to ask of any pipeline
Where a company’s addressable pipeline depends on a small number of named schemes, the exposure behaves like project risk rather than market risk, and it needs underwriting that way. Tracking the market average will not tell you when one of those schemes slips.
The same distribution cuts the other way at the bottom of the market. The tail is where specialist developers and regional operators sit, valuations are less contested, and the competitive dynamics are entirely different from those around the largest campuses.
The natural next question is which schemes make up that top slice, and whether they are moving. That is a project-level question, and it is the one GlobalData’s Data Centre Projects Database is built to answer: it tracks each of the roughly 2,500 developments in the pipeline individually, with its value, stage, location, owner and recent activity, from announcement to completion.
GlobalData’s free whitepaper, The Deliverability Gap, draws on that detail to weight every project by stage and activity, showing how much of the pipeline is genuinely deliverable by 2030. Download it below.
