


The phrase data centre covers two quite different businesses. Hyperscale facilities are built by, or for, the large cloud and AI companies, which fill them with their own computing. Colocation operators build capacity to rent out, hall by hall, to many tenants. The pipeline data shows how differently the two are behaving.
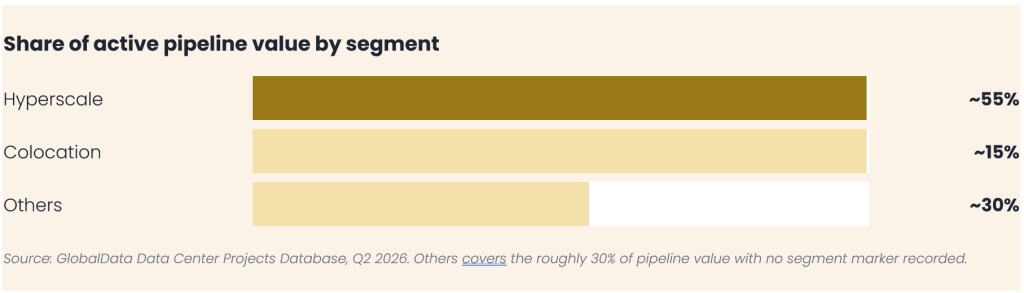
Hyperscale dominates the money. Across GlobalData’s active pipeline it accounts for 55% of value and 56% of recorded capacity, at an average project size of roughly $1.5B. Colocation accounts for 15% of value at an average size of around $620M, so the typical hyperscale project is about 2.4 times larger.
The two segments also build to different specifications. On recorded capacity, hyperscale schemes carry around a fifth more spend per megawatt than colocation, consistent with denser, higher-specification facilities designed for AI workloads.
Different money, different behaviour
The deeper difference is how the two are paid for. A hyperscale campus is financed against the balance sheet of some of the world’s largest companies and built for a known user, usually the owner itself. A colocation facility is financed against future tenant demand and fills up only after it opens.
That difference decides how each responds to trouble. When a grid connection slips by two years, a hyperscaler can absorb the wait, because the demand filling the building is its own. A colocation developer is left holding an empty building against a business plan, which is a much harder position. Colocation’s one advantage is size, or the lack of it. Smaller projects mean less value at risk in any single scheme, where a stalled hyperscale campus can tie up more than a billion dollars at once.
What this means in practice
The split describes two different customers. Hyperscale work arrives in larger, lumpier contracts on more demanding timetables; colocation work is smaller, steadier and spread across more clients. Treating the two as one category blurs both, because a colocation-heavy market behaves differently from a hyperscale-heavy one in its financing, its timing and its counterparties.
Everything else turns on which of the two businesses an exposure actually serves, because the same two-year grid delay produces very different outcomes for each. Telling the two businesses apart at project level is what GlobalData’s Data Centre Projects Database is built for, tracking each of the roughly 2,500 developments in the pipeline with its segment, value, stage, owner and recent activity.
GlobalData’s free whitepaper, The Deliverability Gap, draws on that detail to compare hyperscale and colocation across the full pipeline, and to estimate how much of it is genuinely deliverable by 2030. Download it below.
