1 May
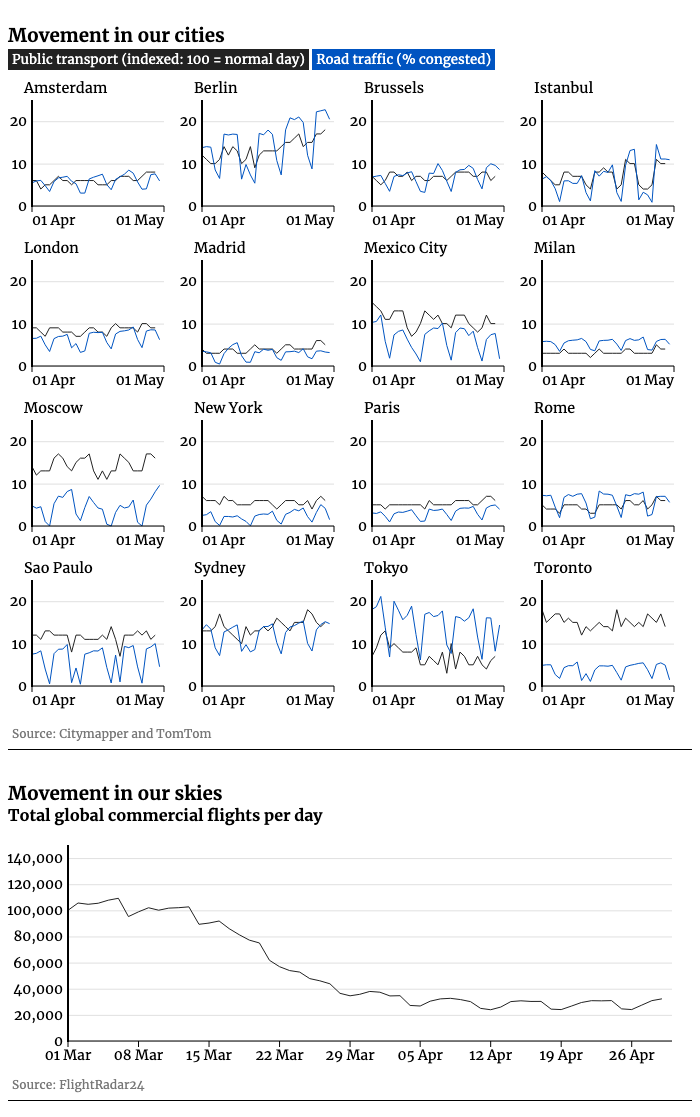
Our weekly mobility chart shows a clear trend: some world cities are seeing increased movement even before lockdown restrictions are eased.
Berlin has seen the biggest increase in both public transport activity and in traffic congestion over the last fortnight.
Schools, museums, galleries, zoos, playgrounds and churches are expected to reopen in Germany on Monday for the first time since the lockdown started. Some shops have already re-opened ahead of the lockdown lift.
Chancellor Angela Merkel – who is riding a wave of popularity on the back of her country’s relative success in controlling the outbreak – has stressed that social distancing must continue, and that the restrictions would return in the event of a second wave.
Madrid, London and Moscow are also seeing small bumps in activity – although the change is slight and could be due to changes in local circumstances rather than a sign people are flouting rules.
How well do you really know your competitors?
Access the most comprehensive Company Profiles on the market, powered by GlobalData. Save hours of research. Gain competitive edge.

Thank you!
Your download email will arrive shortly
Not ready to buy yet? Download a free sample
We are confident about the unique quality of our Company Profiles. However, we want you to make the most beneficial decision for your business, so we offer a free sample that you can download by submitting the below form
By GlobalDataHowever, international travel is still stagnant.
Ryanair and British Airways have both recently announced they are cutting jobs due to low sales, with Ryanair expecting passenger numbers to stay under pre-coronavirus crisis levels at least until summer 2022.
The Covid-19 lockdown: tracking if, when and where the world starts moving again
Restrictions on international and national travel to slow the spread of the virus caused a dramatic fall in global traffic by road, sky and sea. But the picture is not uniform across the world. Some cities in the Far East have avoided a total lockdown and as such have been seeing patterns which are a little closer to the norm.
In order to track the latest situation, this graphic is fed by three key sources. We use Citymapper’s mobility index to monitor public transport use, TomTom’s live traffic index to measure road use, and summary data from FlightRadar24 to count the total number of commercial flights each day.


